Fill in Blanks
Home
1.1 Bivariate Relationships
1.2 Probabilistic Models
1.3 Estimation of the Line
1.4 Properties of the Least Squares Estimators
1.5 Estimation of the Variance
2.1 The Normal Errors Model
2.2 Inferences for the Slope
2.3 Inferences for the Intercept
2.4 Correlation and Coefficient of Determination
2.5 Estimating the Mean Response
2.6 Predicting the Response
3.1 Residual Diagnostics
3.2 The Linearity Assumption
3.3 Homogeneity of Variance
3.4 Checking for Outliers
3.5 Correlated Error Terms
3.6 Normality of the Residuals
4.1 More Than One Predictor Variable
4.2 Estimating the Multiple Regression Model
4.3 A Primer on Matrices
4.4 The Regression Model in Matrix Terms
4.5 Least Squares and Inferences Using Matrices
4.6 ANOVA and Adjusted Coefficient of Determination
4.7 Estimation and Prediction of the Response
5.1 Multicollinearity and Its Effects
5.2 Adding a Predictor Variable
5.3 Outliers and Influential Cases
5.4 Residual Diagnostics
5.5 Remedial Measures
4.1 More Than One Predictor Variable
"Regression analysis is the hydrogen bomb of the statistics arsenal."
- Charles Wheelan
Often when modeling some response variable $Y$, one predictor variable may not be adequate. Thus, more multiple predictor variable scan be used to model $Y$.
As in simple linear regression, we will assume models that arelinear in the parameters (see Section 1.2.3). If the model is linear in the predictor variables as well, then we will call the model the first-order model.
We will present the multiple linear regression model that is linear in the parameters but not necessarily linear in the predictor variables. This type of model is called thegeneral linear regression model.
As in simple linear regression, we will assume models that are
We will present the multiple linear regression model that is linear in the parameters but not necessarily linear in the predictor variables. This type of model is called the
We will present the general model with normal error terms, however,
the model can be specified with errors that are not normal.
The model is \begin{align*} Y_{i}= & \beta_{0}+\beta_{1}X_{i1}+\beta_{2}X_{i2}+\cdots+\beta_{p-1}X_{i,p-1}+\varepsilon_{i}\\ = & \beta_{0}+\sum_{k=1}^{p-1}\beta_{k}X_{ik}+\varepsilon_{i}\\ & \varepsilon\overset{iid}{\sim}N\left(0,\sigma^{2}\right)\qquad\qquad\qquad(4.1) \end{align*} where \begin{align*} & \beta_{0},\beta_{1},\ldots,\beta_{p-1}\text{ are parameters}\\ & X_{i1},\ldots,X_{i,p-1}\text{ are known constants}\\ & i=1,\ldots,n \end{align*} The predictor variable $X_{k}$ can be raised to some power or transformed in some other way. Also, the predictor variable can be the product of two variables. When this is the case, we say the term is aninteraction
term. We will discuss these more in Chapter 6.
The model is \begin{align*} Y_{i}= & \beta_{0}+\beta_{1}X_{i1}+\beta_{2}X_{i2}+\cdots+\beta_{p-1}X_{i,p-1}+\varepsilon_{i}\\ = & \beta_{0}+\sum_{k=1}^{p-1}\beta_{k}X_{ik}+\varepsilon_{i}\\ & \varepsilon\overset{iid}{\sim}N\left(0,\sigma^{2}\right)\qquad\qquad\qquad(4.1) \end{align*} where \begin{align*} & \beta_{0},\beta_{1},\ldots,\beta_{p-1}\text{ are parameters}\\ & X_{i1},\ldots,X_{i,p-1}\text{ are known constants}\\ & i=1,\ldots,n \end{align*} The predictor variable $X_{k}$ can be raised to some power or transformed in some other way. Also, the predictor variable can be the product of two variables. When this is the case, we say the term is an
In multiple regression, we are interested in how the predictor variables relate to the response variable. In particular, we want to know:
Theses questions are relatively simple to answer if the predictor variables are uncorrelated among themselves.
Unfortunately, in real world application, especially for observational studies, the predictor variables tend to be correlated among themselves. When this is the case, we say thatmulticollinearity exists.
Just due to chance, there will always be some correlation among the predictor variables. In general, we will assume the correlation among the predictor variables is low. If the correlation is high, then this may present problems in the analyses. We will the effects of multicollinearity on inferences for the model in Chapter 5.
- How important are the difference predictor variables in modeling $Y$?
- What is the effect of a given predictor variable on predicting $Y$?
- Are any of the predictor variables unnecessary in modeling $Y$ and therefore be dropped from the model?
- Are there any predictor variables not included in the model that should be included?
Unfortunately, in real world application, especially for observational studies, the predictor variables tend to be correlated among themselves. When this is the case, we say that
Just due to chance, there will always be some correlation among the predictor variables. In general, we will assume the correlation among the predictor variables is low. If the correlation is high, then this may present problems in the analyses. We will the effects of multicollinearity on inferences for the model in Chapter 5.
In simple linear regression, we should always visualize the relationship between $X$ and $Y$ with a scatterplot.
In multiple regression, we will also need to visualize the relationships between the predictor variables and $Y$. This cannot be done with just one plot unless $p=3$ in which we can construct a three-dimensional scatterplot. If $p>3$, the plots would need to be in more than three-dimensions (cannot be done).
If the value of $p$ is not too large, then we can visualize the relationships with ascatterplot matrix . Here each predictor variable is plotted against the others in a scatterplot as well as against the response variable $Y$.
One of the reasons one needs to construct a scatterplot among the different pairs of $X$s is to see if there is any significant correlation among them. If so, we can start to see evidence of multicollinearity.
The scatterplot matrix can be found in R using thepairs function in base R or with the ggpairs function in the GGally library.
In multiple regression, we will also need to visualize the relationships between the predictor variables and $Y$. This cannot be done with just one plot unless $p=3$ in which we can construct a three-dimensional scatterplot. If $p>3$, the plots would need to be in more than three-dimensions (cannot be done).
If the value of $p$ is not too large, then we can visualize the relationships with a
One of the reasons one needs to construct a scatterplot among the different pairs of $X$s is to see if there is any significant correlation among them. If so, we can start to see evidence of multicollinearity.
The scatterplot matrix can be found in R using the
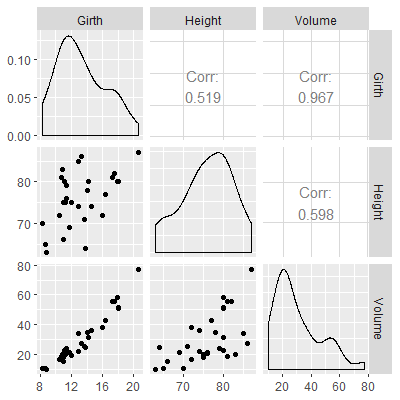
In the trees dataset from Example 2.2.1, the variable Height is also included. If we want to model Volume based on the predictor variables Girth and Height, we can start by plotting the scatterplot matrix.
ggpairs gives more information on all the variables in that it gives a density estimate of the variable as well as give the correlation for each pair of variables. The downside is that ggpairs tends to take longer to produce than pairs .
library(datasets)
library(GGally)

pairs(trees)


ggpairs(trees)